Our brewery sales projections template is our second best-selling template. If you want to start a brewery, chances are you’ve also considered opening multiple restaurants and taprooms, which are the best way to control how the end user enjoys your product. For that reason, we’ve created a new Multi-Location Brewery / Restaurant Template. In this blog post, we want to walk you through the template and offer tips and tricks to getting accurate, helpful financial projections, whether you need them for a bank, a potential partner or investor, or just for your own planning.
Step 1. Purchase and Download the Template.
You can purchase and download the template here. You can preview many tabs from the template in this blog post. Even if you don’t choose to use our template, this guide should help you put together your own projections.
Step 2. Fill Out the General Assumptions.
When putting together financial projections, you have to start with the basics. You’ll want to gather some information and answer a few questions:
- What will you name your business?
- When do you plan to start operating?
- Will you need funds from an investor or a loan from a bank?
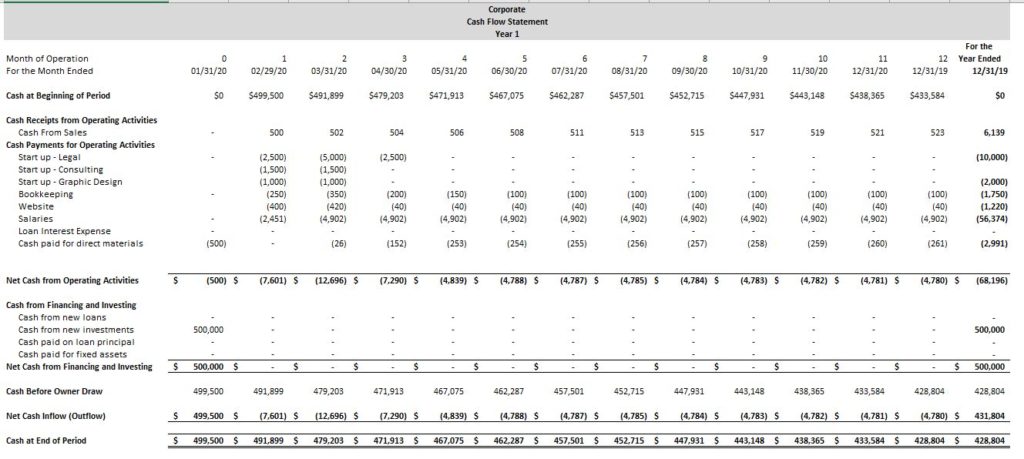
If you’re using our template, you can input this information on the “Input- General Assumptions” tab. Helpful Hint: if you’re not sure how much money you need from loans or investors yet, continue to put together your projections. At the end, predicted cash flows will show you if you’ve estimated your starting cash balance correctly or need to adjust.

Step 3. Predict Your Corporate Financials
If you want to start a multi-location brewery / restaurant chain, you will eventually have some shared expenses that aren’t specific to any one unit. You might outsource bookkeeping to a bookkeeper who will consolidate financials for every unit, and you might invest in some internet or local advertising that could benefit many locations at once.
In addition to those shared, eventual expenses, you might pay for some items up front that could benefit the entire corporation and not just one unit. In our template, we consider three start-up expenses that are corporate expenses, and not just related to a single unit: Legal, consulting, and graphic design. This is not an exhaustive list, but it’s important to consider that once you’re a corporation, you won’t have to re-incorporate for each new unit. In the same way, once you have a logo, you can use it for every location.
In our template, you can fill out the expenses as guided on the “General Assumptions” tab. To separate start-up expenses, we allow you to individually input expenses for the first three months, and then set them each year to save you from re-entering every expense for 60 months. Helpful Hint: remember to enter monthly amounts across the entire table.

Dollars spent on legal, consulting, and graphic design are booked to the income statement as expenses, but some cash outflows are considered the purchase of assets. If you purchase a warehouse to store barrels of beer, that asset will benefit you for several years, so it is initially booked to the balance sheet as an asset and slowly expensed through depreciation on the income statement. Corporate assets are assets that don’t benefit any one unit specifically. A few examples might be a warehouse or an office space.
To add assets to your model, fill out the table on the “General Assumptions tab”. Even if you don’t plan to purchase assets right away, keep in mind after a few years you may find a need for a corporate office or warehouse. You can change the month the asset is purchased to show assets purchased later in the projection period. Helpful Hint: the life expectancy and salvage cost are used to calculate depreciation expense.

In some cases, your corporate entity may earn some revenue independent of any physical location. Perhaps you sell merchandise online or license your brand or logo to another entity. You can enter corporate income on the “Input – Revenue & COGS” tab of the template, right at the top under “Corporate Sales”. Corporate income follows a simple growth revenue model as it likely will be a very small percentage of your total income.

On the “Input- General” assumptions tab you can adjust the accounts receivable and inventory assumptions for the corporate entity. AR and inventory are balance sheet asset accounts related to revenue.
If your corporate entity earns revenue, you will likely have direct expenses associated with that revenue. If you sell merchandise, the cost of the t-shirts and pint glasses is cost of goods sold, or COGS. The best way to calculate COGS is to predict it as a percentage of revenue for your model, and then calculate COGS each month by taking monthly revenue times that percentage.
You can calculate your average COGS % by dividing the cost (to you) of any goods sold by their sales price. For example, if your supplier charges you $7.50 for a pint glass with your logo, and you plan to sell it for $15, your COGS% is 50%. On our template, you can enter COGS% on the “Input – Revenue & COGS” tab and the dollar value of corporate COGS will be calculated for you each month on the financial statements
Step 4. Predict Your Location Types and Openings.
Once you have corporate items squared away, it’s time to turn your attention to the actual locations. In our template, we allow you to create three different types of entities: the brewery, tap rooms, and restaurants. You can select the types of units and their opening months on the “Input – General Assumptions” tab.

The template produces projections for 5 years. Five locations in 5 years is an impressive pace, and if you plan to grow a little slower you can delete the starting dates and model types from the last few units and they will be left out of the projections.
Helpful Hint: If you’re not settled on opening dates for future locations yet, you can always adjust dates when you see the final financial statements. You may choose to open new locations when you hit a certain dollar value of cash in the bank, which can be determined on the cash flows statement.
Step 5. Create Some Unit-Specific Assumptions.
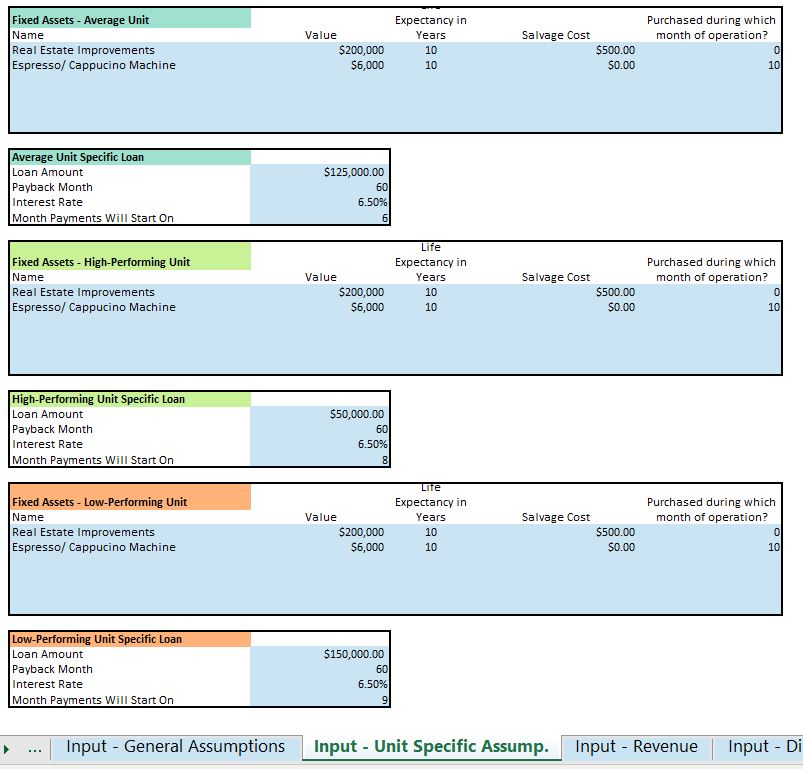
Once you’ve settled on start dates, you can begin to build the models for the three different types of locations. Each unit will have its own assumptions related to asset purchases and new loans. In our model, you can enter these assumptions on the “Input – Unit Specific Assumptions” tab.
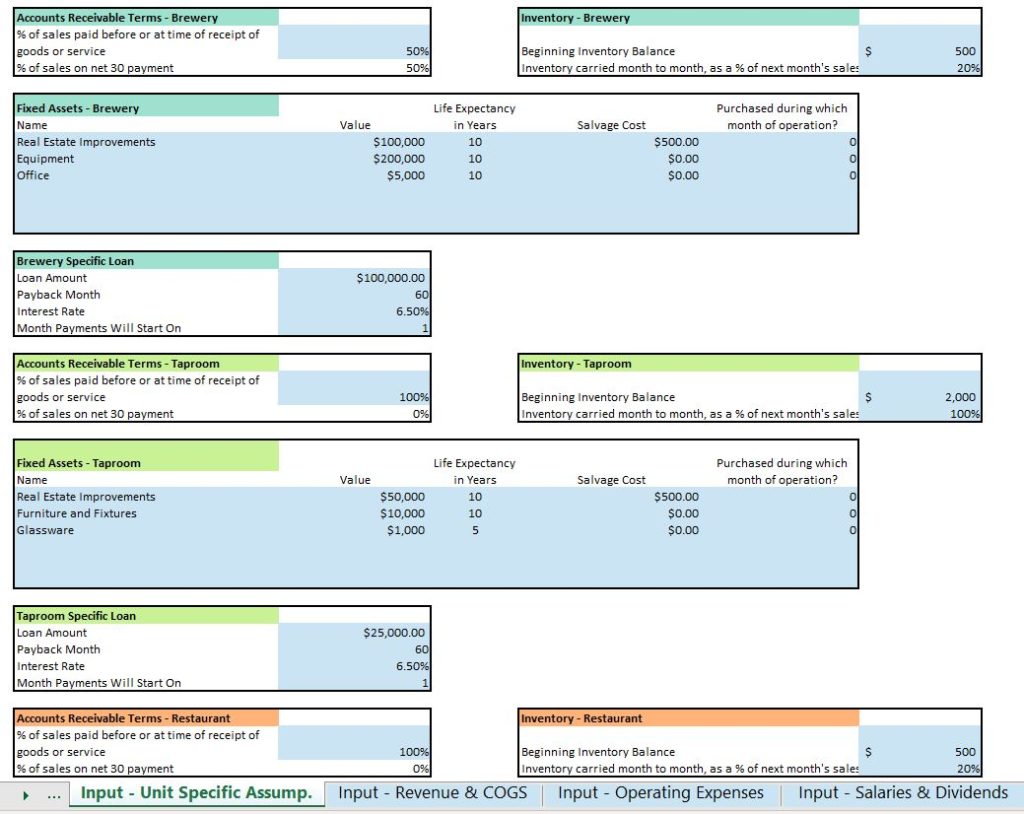
Examples of assets might include:
- Real Estate Improvements (renovations to the building)
- Building (if you plan to purchase a space rather than rent)
- Furniture and fixtures
- Glassware, silverware, and dishes
- Brewery Equipment (check out this helpful article on brewery equipment)
- Kitchen Equipment
- Signage
Helpful Hint: There are a few assets pre-filled in our template, but you can choose to keep, delete, or change that data as you see fit. The pre-filled data is for example purposes.
When building individual location models, you should also consider loans. Do you plan to take out a new loan to open each location, or do you hope to generate enough cash from your other units to open a new location without debt? If you plan to purchase your buildings, you may plan to have a mortgage on each building.
In our template, you can enter location-specific loans on the “Unit Specific Assumptions” tab. The loan amounts and terms (or whether you take out a loan at all) can be different for the three types of locations. The model will automatically add the corresponding loan to the balance sheet each time you open new location, if that location type has a loan associated with it.
Just like the corporate entity, your individual locations can carry inventory or have accounts receivable. These items are usually calculated as a percentage of revenue. In our model, AR is calculated as percentage of the current month’s sales, and inventory is predicted based on a percentage of the sales in the next month of the model. You can enter these percentages on the “Unit Specific Assumptions” tab.
Step 6. Revenue Models
Once you’ve set all your basic assumptions, it’s time to move onto the most important part of any financial projection: the revenue model.
In our template, the revenue model includes direct expenses (COGS) and is on the “Input – Revenue & COGS” tab. Our template begins with the COGS model for the brewery.
Brewery COGS Model
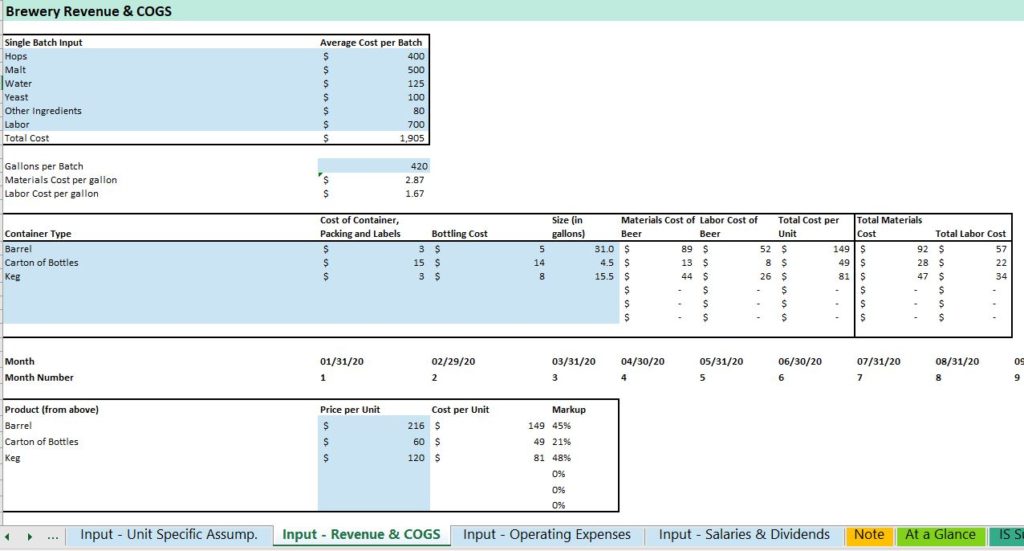
Before calculating brewery revenue, we find it helpful to calculate the cost of goods sold. This follows the pattern of the actual creation of beer as well – there would be no revenue without the expense of first creating the beer.
Our model calculates the cost per batch of beer. You can measure a batch however you’d like. In our example model, we decided one batch resulted in 420 gallons of beer. From there, we estimated the cost if the ingredients for one 420-gallon batch.
While the costs of beer will be variable based on beer type, this is a good time to make some assumptions about your average batch. Does your lager take twice as much yeast as your ale? Estimate your yeast cost somewhere in the middle. Inevitably the consumer will drive what beers you produce and sell most often, and consumer taste is hard to predict. It’s not worth it to get too nit-picky at this stage, just make sure your estimates are reasonable.
In addition to the hops, malt, yeast, water, etc., you’ll also have to pay a brewer (or yourself) to create the beer. To estimate labor cost, estimate the number of hours of time your brewer will be directly working on a batch of beer, and multiply by his or her hourly rate. Helpful Hint: Make sure you keep labor costs in the last row of the input box.
Our model will automatically calculate material and labor cost per gallon of beer. Next, you can define the different types of containers you will use to distribute beer. Each container will come with its own material and packing costs, which can be input into the model as shown above. The model will then calculate the total material and labor costs of the beer and the container.
Once the cost of your beer has been established, you can set the wholesale price of the different containers in the bottom box shown in the above image. The model also includes markup percentage for your reference.
Wholesale Revenue & COGS
Our model assumes that the beer you sell directly to consumers will be through your taprooms and restaurants, so the only way for the brewery itself to earn revenue is through wholesale. You can establish how many of each type of unit you will sell wholesale in each of the first 6 months of operation. From there, the model will use a growth rate you select to slowly increase the sales of each type of container over time. The model will automatically calculate wholesale COGS based on the COGS already calculated for each type of container.

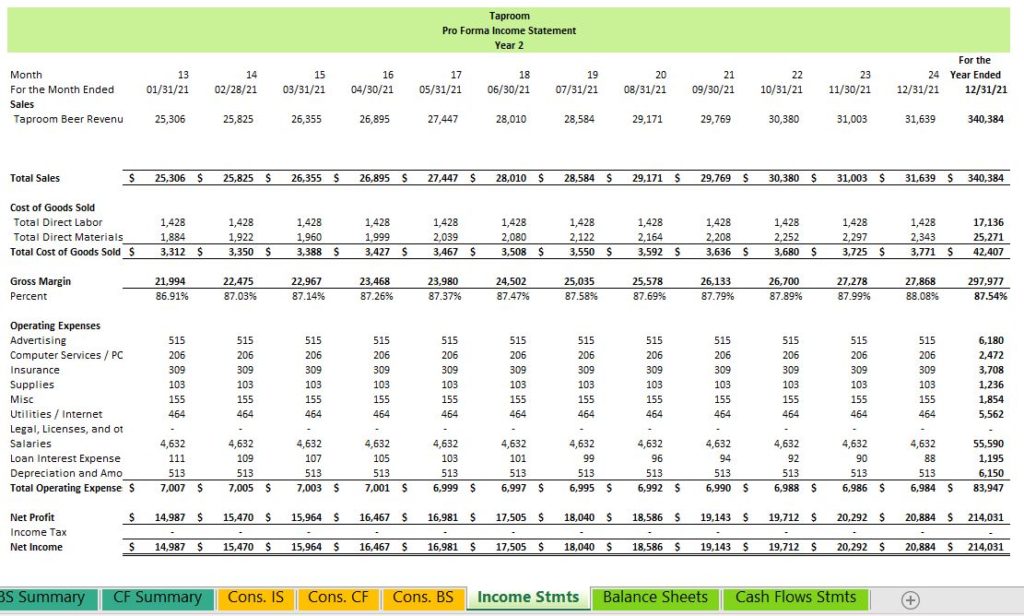
Taproom Revenue & COGS
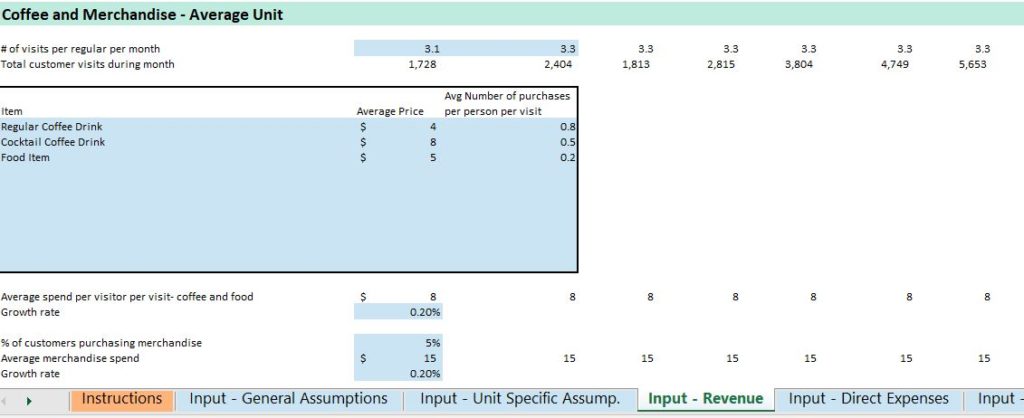
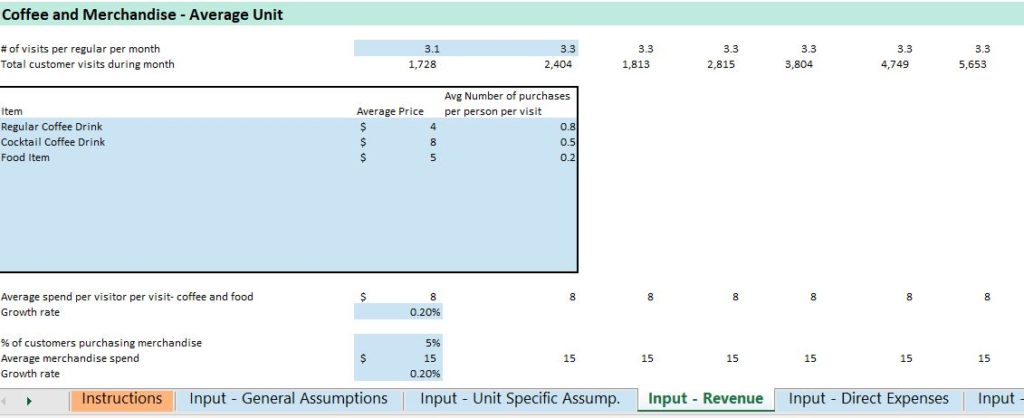
The next type of location you can build in our model is a taproom where you can sell your in-house beer. The taproom revenue model is based on the number of available seats in the room, and the % capacity filled for each hour of business. Helpful Hint: keep your % capacity low if you want to have conservative projections. While you might have a few busy hours each night, you will probably have enough light hours at the beginning and end of the night to average out to a lower % capacity filled. We like to use the pattern shown below, which factors in excitement around the opening of the taproom, and then a decline for the following months and a steady increase after month 6 to account for the build up of regular customers.
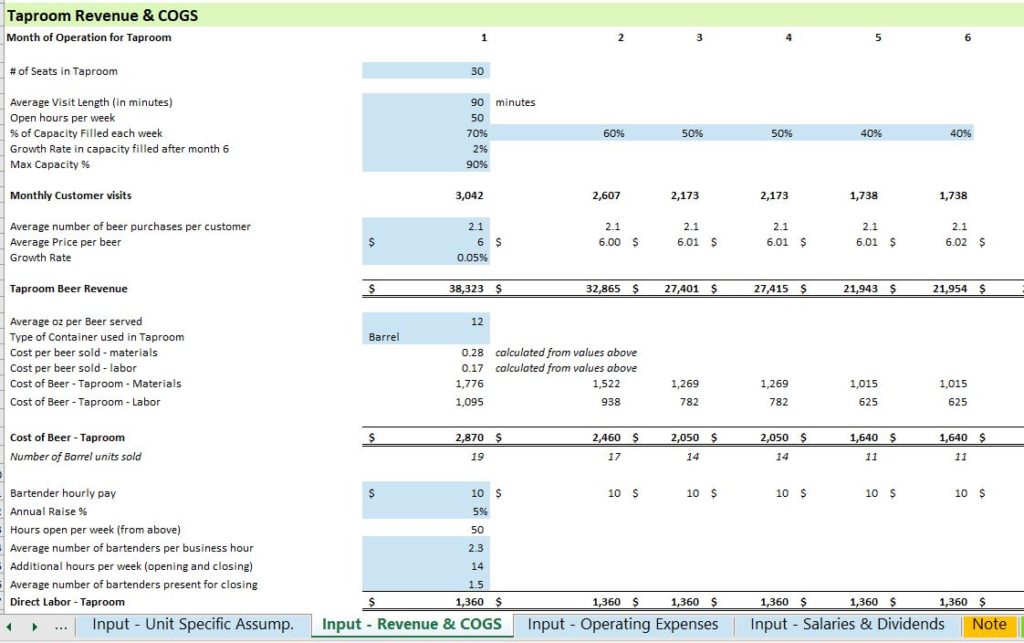
Once we have monthly customer visits calculated, we move on to beer purchases. Set the average beer purchases per customer and the price per beer to calculate Taproom Beer Revenue. Next, the model calculates the cost of beer served in the taproom by asking you which type of container you use to distribute beer in the taproom. From there, it pieces out the cost of beer based on the number of ounces per beer sold.
Cost of beer is considered a direct cost for the taproom, as it goes directly into the revenue earning process. The other direct cost for a taproom is the pay of your hourly laborers. Our model helps you predict bartender pay by calculating the number of bartenders per business hour, their hourly pay, and adding it to pay for additional opening and closing hours.
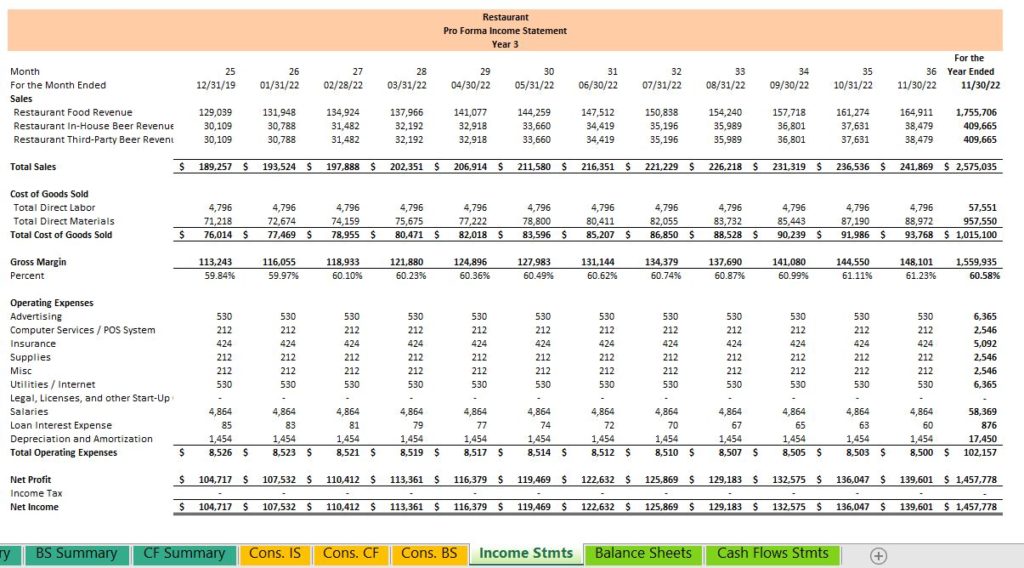
Restaurant Revenue & COGS
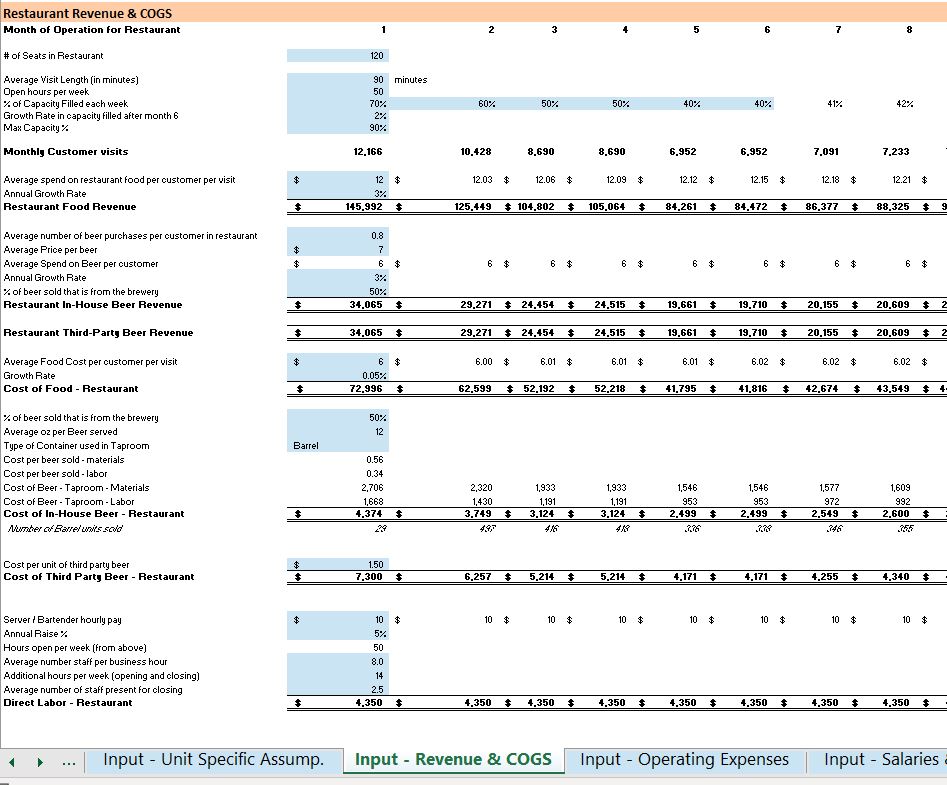
Restaurant revenue and COGS is very similar to the taproom model, but it incorporates a few extras such as sales of third-party beer, food, and server wages.
Step 6. Other Expenses
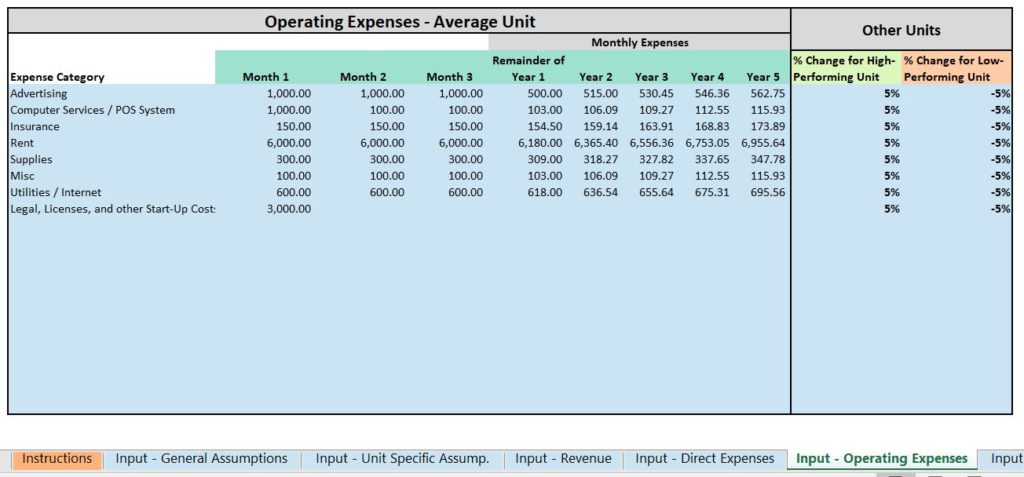
In addition to direct expenses, your brewery, taprooms and restaurants will have indirect operating expenses, or overhead. Some examples of overhead expenses include:
- Advertising
- Computer Services / POS System
- Insurance
- Rent
- Supplies
- Utilities / Internet
- Legal, Licenses, and other Start-Up Costs
Some of these expenses will occur every month, but others are start-up costs that you only pay once. Helpful Hint: be careful not to include assets in your start-up costs. Assets are items that will provide you value over time, whether tangible or not. A good example of an intangible asset is a security deposit on your rental.
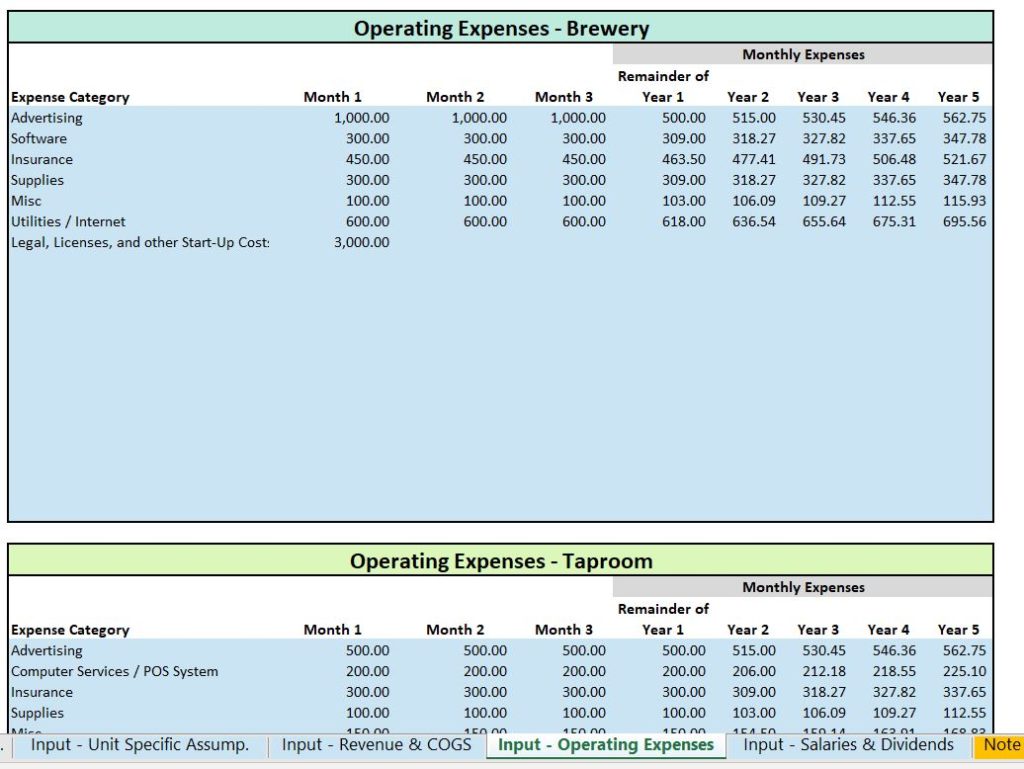
On our model, you should input expenses in monthly amounts. We’ve broken out the first three months individually to help you account for start-up costs that don’t occur every month. The remainder of the months in the model are grouped by years, and the expenses will be the same every month for an entire year.
We include three different boxes for determining operating expenses for the three types of locations.
Step 7. Salaries
The last piece of our individual unit predictions is salaries. Direct labor has already been calculated, so the salaries we calculate here are only for indirect employees like managers, bookkeepers, or CEOs. When calculating salaries, be sure to include benefits and employer taxes in your budget. In our model, we allow you to define employees for the various types of locations and the corporate unit by marking the number of employees on the far right.

In the above example, the second line represents managers at both the taprooms and restaurants. Mangers at both types of locations get paid $45,000 per year. Note neither the brewery nor the corporate unit have a manager. In the same way, the CEO and bookkeeper are employees of the corporate unit and their salaries will be represented on the corporate income statement.
Step 10. Dividends
If your brewery business is a corporation, you may pay your shareholders (or yourself, if you are a shareholder) dividends. There are tax implications of paying dividends, and we recommend you discuss these with a tax accountant in your area. Dividend payments can act like a type of salary or loan payment to various shareholders. If you choose to pay dividends, you can enter them on the “Input- Salaries & Dividends” tab. Paying dividends reduces the cash balance of the business but is not considered an expense on the income statement.
Step 11. Putting it all together
Once we’ve predicted all the inputs of our financial model, it’s time to put it all together. Here are the steps we followed to put together our template:
- Create the month-to-month financial statements for each type of location plus the corporate entity.
- Layer the month-to-month financials for each location together based on unit start dates and types of units.
We chose to show the financial impact of each location (rather than each account) on our consolidated financials, except for a few key accounts, which are broken out separately:
- Cash
- Investments
- Dividends
- Retained Earnings.
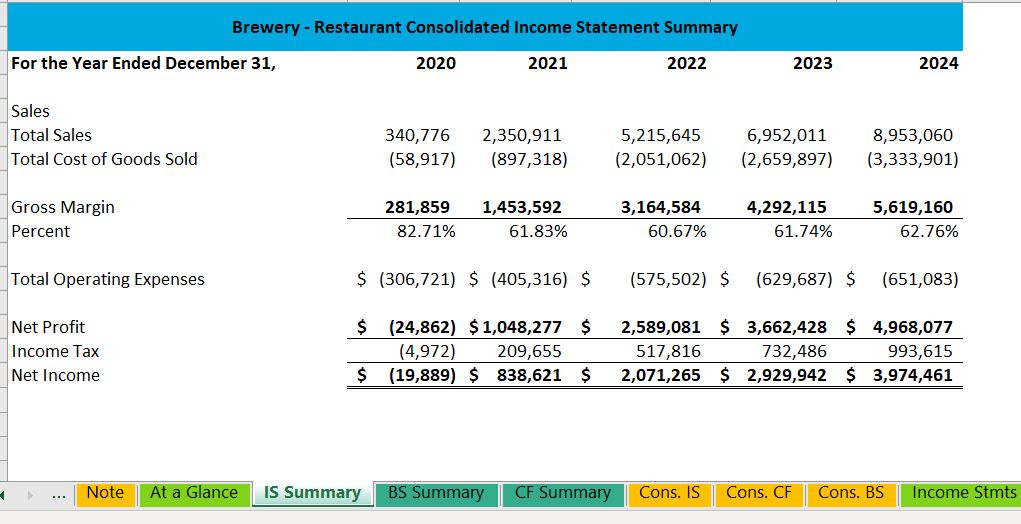
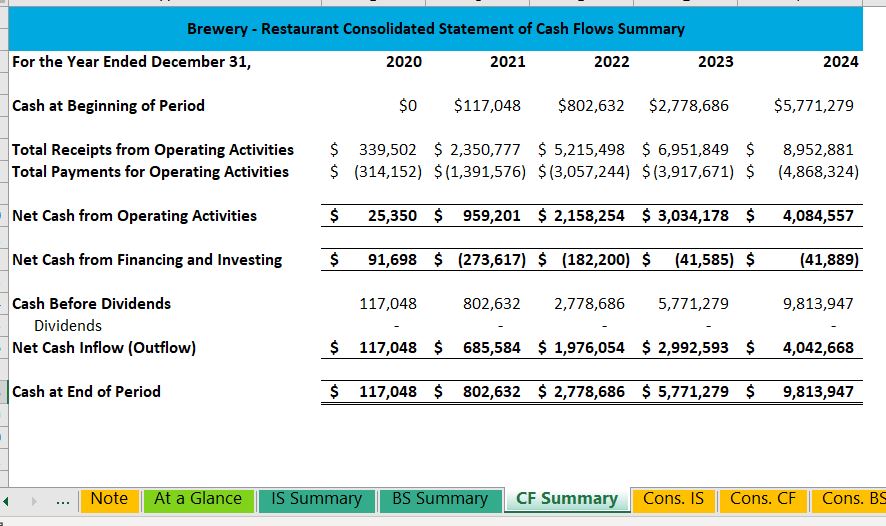
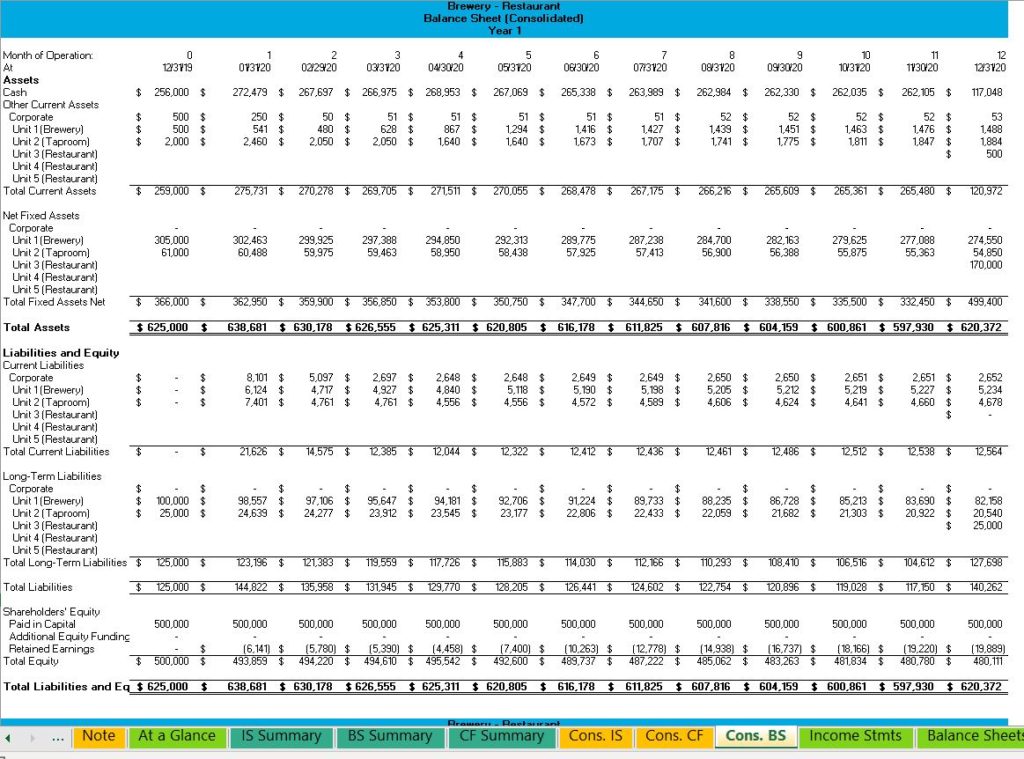
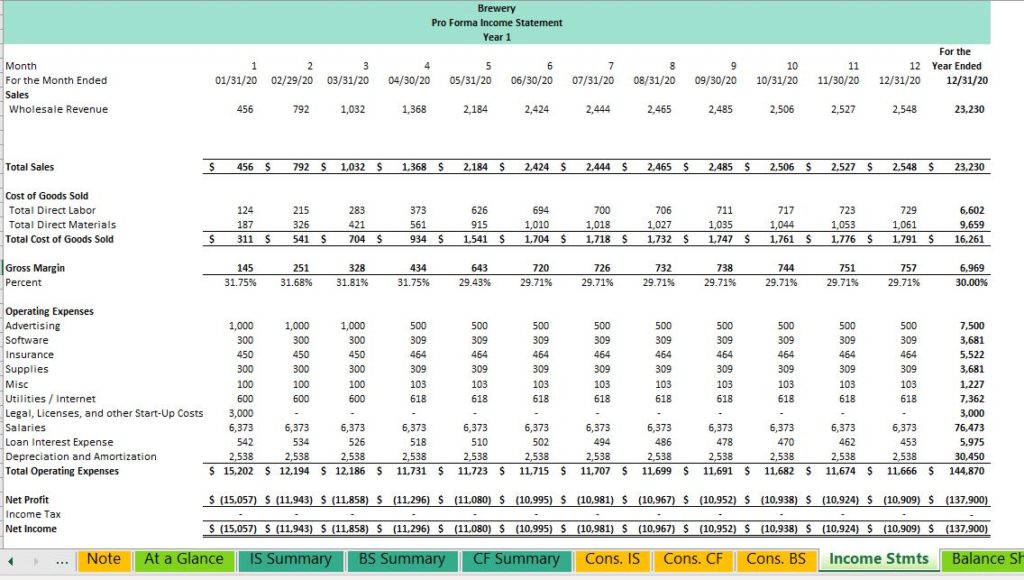
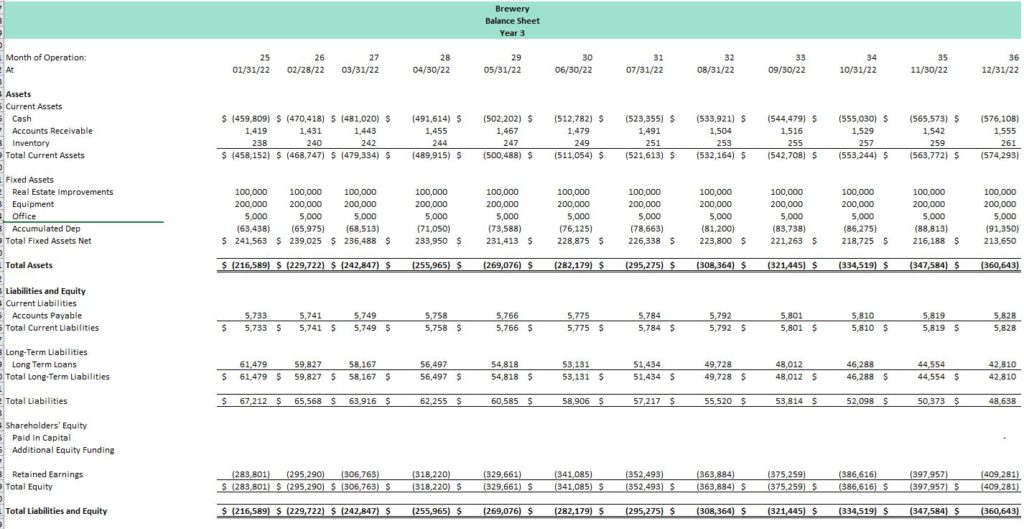
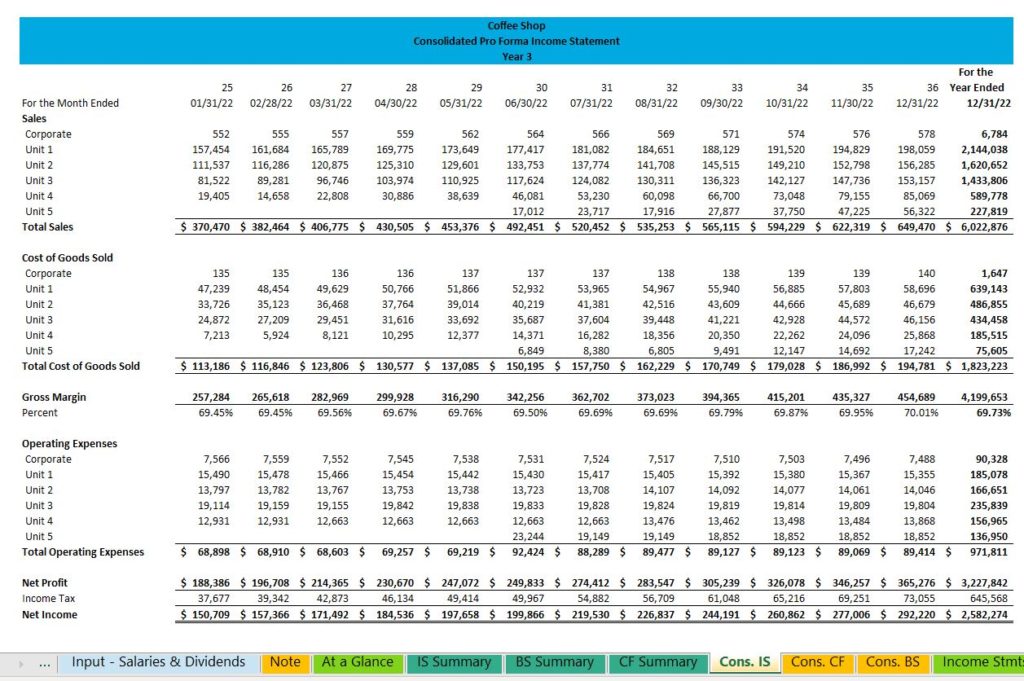
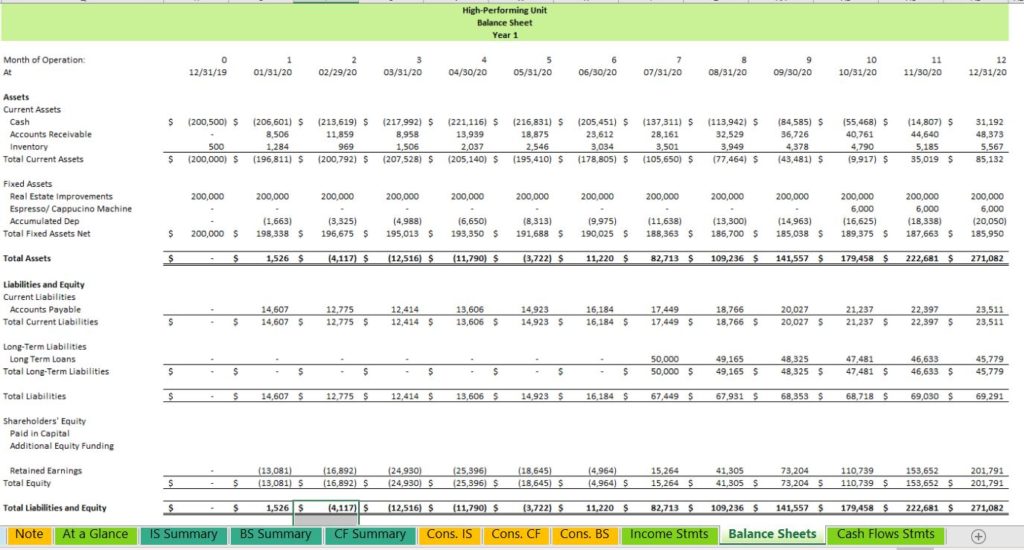
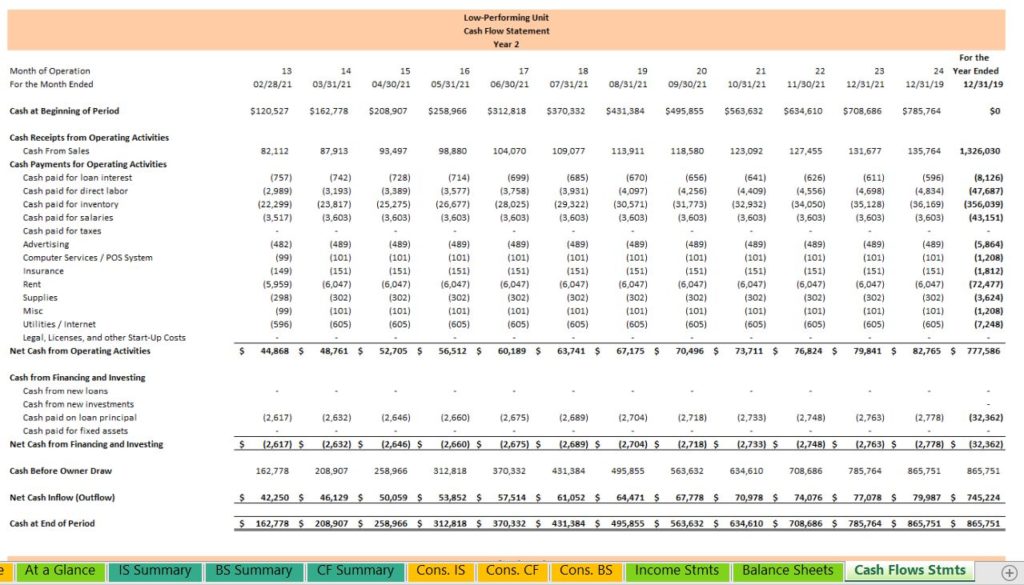
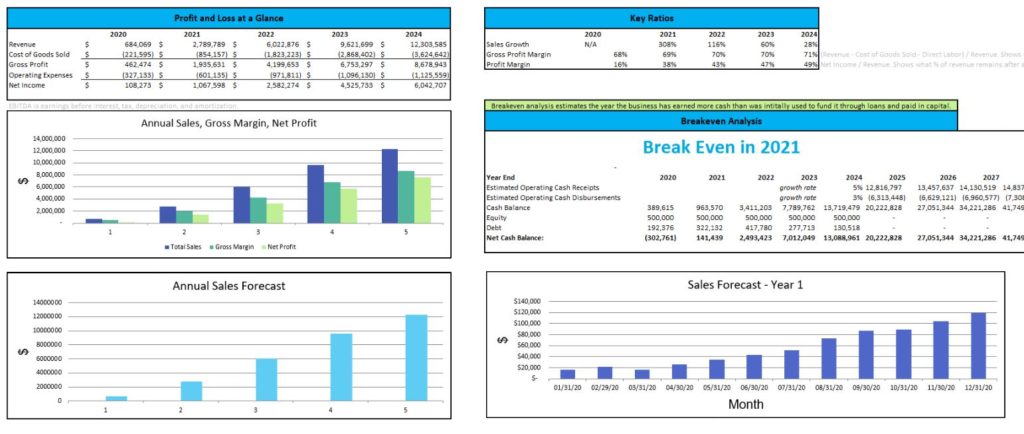
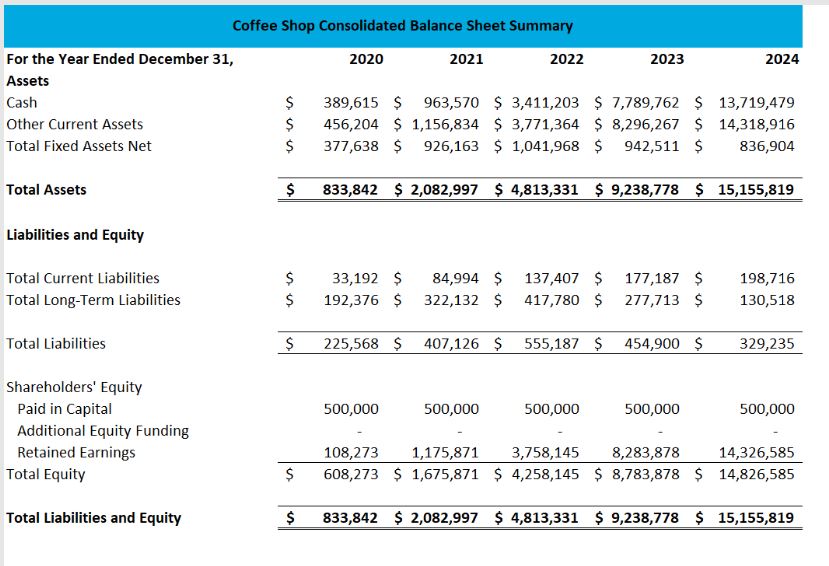
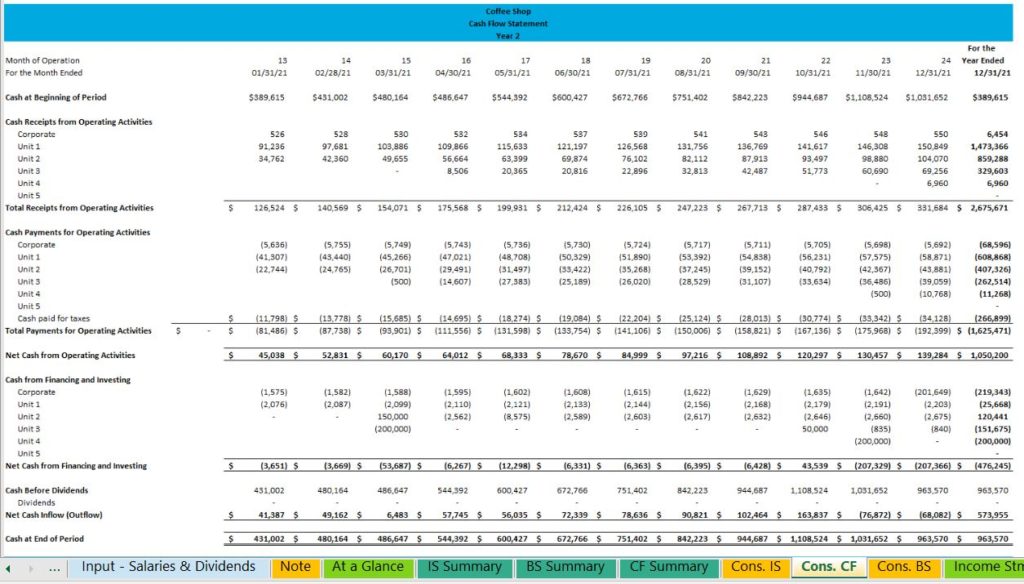
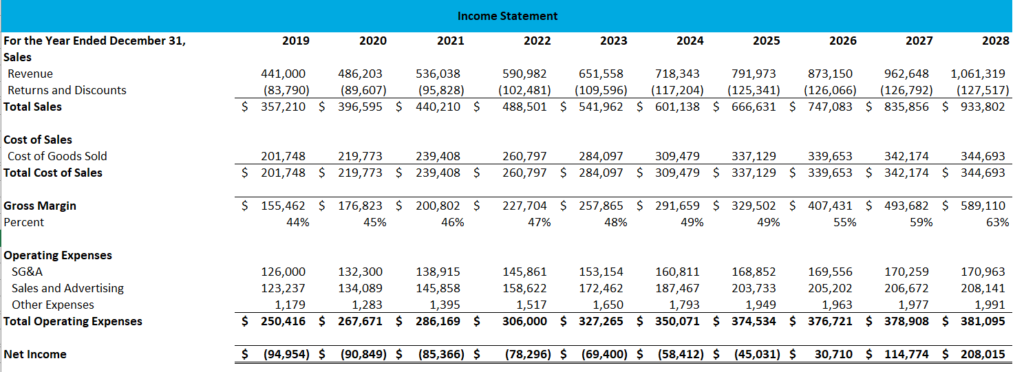
Below are some screen shots of the individual and consolidated financial statements from our model.

