 According to a report by the Georgia Small Business Development Center, there are nearly 175,000 businesses in the US that are classified as Mechanical Automotive Repair Shops. There are thousands of new auto repair shops that start each year. The challenge is that many new owners are great mechanics, good with cars, and assume they can run a successful business. Just like a good cook is not always a good restaurant owner, a good mechanic is not always a good auto repair shop owner.
In this article, I am going to walk you through the process of creating financial projections for the first 3 years of business as an Auto Repair Shop. To open your shop you are probably going to need to get a loan or investment to get started. The purpose of this article is to help you create a set of financial projections that will help you secure a loan or investment to start your shop.
The hardest part of creating financial projections for an auto shop is creating a sales projection model. So I am going to create an auto repair shop financial template that you can download. Just look for the Auto Repair Shop revenue projection template.
Lets get started.
Sales Projections for New Auto Repair Shop
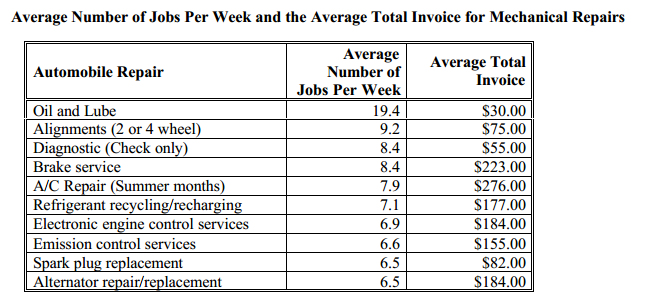
In my opinion, sales for an auto repair shop rely on your number of repeat/loyal customers. According to the Georgia SBDC report, there are 10 general services that the average auto shop will provide. The following table shows the 10 services, the average number of jobs per week of that service, and the average price for that service.
So in order to create realistic projections for your startup, you can’t just assume that you are going to start out from day 1 doing the average. You are going to have to win those customers, and then find ways to get them to come to you for all of their auto service needs. So I am going to go through the process that I would go through if I were starting an auto repair shop in a community.
Step 1 – Potential Market
So first I would start with determining your market potential in terms of customers. Actually, you might look at each customer as a vehicle. So how many vehicles are there within the geographic area that you can serve? Maybe customers would potentially come 20 miles to your shop, so your potential market is the number of vehicles within a 20 mile radius of your shop.
Step 2 – Initial Marketing Budget
Once you get an initial base of customers you might be able to grow and sustain the business based on word of mouth and referrals, but initially you are going to have to do some marketing and advertising to get a base of customers who can then hopefully help spread the word. You will probably have to run some cheap deals to get customers to try your shop, they won’t likely switch for nothing.
Step 3 – Cost to Acquire 1 New Customer
Initially you need to know the cost to acquire 1 new customer so that you can set an adequate startup marketing budget. You need to have enough money set aside for initial marketing to be able to secure a core of repeat customers. So maybe you send out mailers with coupons for a $10 oil change. You will need to estimate how much it will cost to send out each mailer and what percentage of people who get the mailer will actually come in. That represents your cost to acquire a new customer.
Step 4 – % of New Customers that Turn Into Repeat Customers
Now out of these new customers what percentage will turn into repeat customers? Maybe 25%? You will have to make an educated guess here. You can be sure that every new customer will not turn into a repeat customer, the question is what is that percentage.
Step 5 – % of Customers that Recommend your Service
Once you build that initial base of repeat customers, some percentage of them will share about your shop. It is very common for people to ask each other where they take their car when it has a problem. Not everyone is going to share, maybe it is just 5%, but those 5% can be very powerful.
Step 6 – Average Number of People your Customers Share your Service with Each Month
Now that you assume 5% will share with other people, you have to estimate how many people they will share with each month. Maybe they only share once every 4 months, so you would estimate that they share with .25 people each month.
Step 7 – What % of those Shared With Actually Become Customers
Next you need to determine what percentage of those people that they shared with will actually come to the shop as a customer. Then again you are back to the same question, what percentage of those new customers will become repeat customers.
Step 8 – Total Customers per Month
Finally, you will get to your total customers per month. So in this model that I am building, this number represents your repeat customers. This is not asking how many actually come to the shop each month, just how many people would you consider to be on your repeat customer list. Maybe it is 2,000 vehicles. Of course not every customer comes in every month, but we will address that with the next step.
Step 9 – Average Revenue Per Customer Per Month
So rather than try to estimate what percentage of your customers will come in each month, it might be easiest to just estimate an annual dollar amount that the average vehicle will cost an owner each year in repairs and maintenance. Maybe that number is $1,000 per year for the average car. So then all you have to do is divide $1,000 by 12 months and you end up with your average revenue per customer per month.
Step 10 – Total Revenue
Finally, you will take your average revenue per customer per month and multiply by your number of active repeat customers. Those 1 time customers will also help you generate revenue, but it might be likely that you are offering such steep discounts to get them in the door, that you don’t make any profit on those jobs. You should still show the revenue for 1 time customers, but your focus should be completely on those repeat, loyal customers.
Cost of Goods Sold for an Auto Repair Shop
First, let me define Cost of Goods Sold for you. Your cost of goods sold is any expense that you incur when your provide a service. Essentially you have 2 primary cost of goods sold categories.
- Material Cost – These are the costs for purchasing parts or materials for a customer’s vehicle. So if you buy parts for a customer’s vehicle and then add 30% to the cost of the part to charge to the customer, then your cost of goods sold would essentially be 70% of your parts and materials sales. This is not quite accurate, but probably close enough for your projections.
- Labor Cost – This is actually a tough question. First, do you pay your staff the same amount whether there is a full day of work or not? Or do you pay them directly based on the specific jobs that they completed that day? If you pay based on the jobs completed, then you have labor costs. Let’s say you charge $100 per hour to the customer for labor, and you pay your mechanics $15 per hour, then your labor cost should be between 15 and 25% probably. Why wouldn’t it be 15% flat? Because you should consider taxes and benefits that you pay to mechanics as well. If you just pay by the hour, then it might not make sense to enter in any labor costs in your Cost of Goods Sold section and just enter in Salaries/Wages in your Operating Expenses section.
According to BizStats, the average Cost of Goods Sold for an Auto Repair Shop is 46.72% of your total sales.
Operating Expenses for Auto Repair Shop
The easiest way to estimate your operating expenses for your auto shop is based on industry data provided by sources like BizStats. The following categories and expense percentages are taken directly from BizStats:
| Officers Comp. | 7.40% |
| Salary-Wages | 12.86% |
| Rent | 6.64% |
| Taxes | 3.21% |
| Advertising | 1.18% |
| Benefits-Pension | 1.28% |
| Repairs | 0.94% |
| Bad debts | 0.11% |
| Other SG&A Exp. | 11.55% |
| Amort. & Dep. | 0.00% |
| Interest Earned | 0.01% |
| Interest Expense | 0.59% |
| Other Income | 0.52% |
| Net Profit | 6.58% |
All of these operating expenses are expressed as a percentage of sales. So first you will need to create your sales projections and then you should be able to apply these percentages to your sales.
Startup Expenses for an Auto Repair Shop
According to an article by AppointmentPlus, the average startup costs are as follows:
- Lift with Installation – $4,000
- Insurance Cost per Year – $4,000
- Tools – $15,000
- Diagnostic Machine – $5,000 to $10,000
- Rent – $1,500 to $15,000 per month
Your startup costs could range between $25,000 and $75,000 especially if you are planning on keeping some reserve funding to pay rent and other operating expenses during the first several months before you are at a breakeven point.
If you work through this process and present your plan to a potential lender or investor, you will be more sophisticated than many auto repair shops right off the bat. If you need any help as you are creating your financial projections, feel free to reach out to me at adam@projectionhub.com

Leave a Reply