Are you considering opening a retail business? Before you buy a building, or sign a lease to set up shop, you will want to run some numbers and determine whether you can generate enough sales to run a profitable business. According to a report published by the US Census Bureau, US Retail and Food Service sales for September 2014 reached over $442 billion. Out of $442 billion each month, how much revenue will you be able to carve out in your retail business?
Before we dig into the details of creating a revenue model for retail businesses, there is a question we have to answer first:
What Types of Businesses are Considered Retail Businesses?
Well according to the Census Bureau Report the following businesses are considered retail:
- Motor vehicle & parts dealers
- Furniture stores
- Electronics and appliance stores
- Building material and garden supply dealers
- Food and beverage stores
- Health and personal care stores
- Gasoline stations
- Clothing stores
- Sporting goods, hobby, book and music stores
- General Merchandise
- Miscellaneous store retailers
- Food services and drinking places
If your business falls into one of these categories, then you are a retail business. Retail businesses will typically build a revenue model in a similar way. Now I am going to outline the key aspects of a retail revenue model and then provide an Excel template that you can use to create your own revenue projections.
Retail Revenue Model
1. Establish your Target Market and Monthly Leads
The first thing you need to do is establish your target market. So in retail what is your target market? Let me give you some examples:
A store in the mall – if you are a store in the mall, maybe your market is the number of people who visit the mall each year. Then you would probably narrow it down from there to get a target market. For example if you are a women’s clothing store, your target market is probably the number of women who walk into the mall. To get this data, simply call the mall you are looking to open in and you should be able to get this data.
A Gas Station – for a gas station, your market is the number of vehicles that drive by your station each day. You can find this data from your state’s department of transportation website. They will typically provide traffic data that will help you estimate your market.
A Grocery Store – this is probably based on geographic location. Your market is probably the population in a particular radius around your store. This can vary drastically depending on where you are located. In the middle of Wyoming your market might be a 100 mile radius. In New York City, your radius might be a few city blocks.
A Car Dealership – this is a tough one. Your market could be anyone within a 50 mile radius, but if you are a Ford dealership, it might be that your market is only individuals willing to buy a Ford in your radius. There are probably many people in that radius that would never buy a Ford.
Once you have you target market estimated, you should estimate the number of new leads you will get each month from that market. You might decided that everyone in the market is a lead, or maybe just the cars that exit off of the interstate if you are a gas station.
2. Conversion Rate of Leads to Customers
Once you have your target market identified, then you need to determine a percentage of your potential customers that will actually become customers. This is probably the most difficult thing you will have to estimate within your revenue model. For every other number there is data that you can find, but your conversion rate is so unique to your specific situation. In order to make your initial estimate it might be best to go do some first hand research. For example, spend some time at a competing gas station, grocery store, coffee shop, etc and count the number of customers they have in a day. This will at least give you a frame of reference for what to expect.
3. Percentage of Customers that are Repeat Customers
For many retail businesses they have a base of repeat customers that come back day after day, week after week, month after month. You will need to make an educated guess at the percentage of customers who are repeats. There will be some percentage of customers who try your establishment once and then never come back, but hopefully many will come back again and again.
4. Average # of Purchases per Month per Customer
Next you need to estimate the number of times you expect customers to purchase each month. If you are a grocery store you might estimate once a week. A coffee shop, maybe 3 days a week. A high end restaurant maybe once a year for special occasions.
5. Average $ Amount of a Purchase
The final major assumption is the dollar amount per purchase. You can probably estimate this pretty easily. At a furniture store you can just take the average price of your furniture items. At a bar, what is the price of a drink x the number of drinks the average person orders.
6. Total Monthly Sales
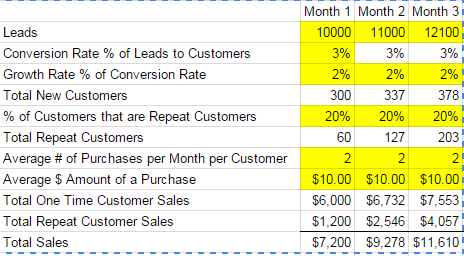
Once you make all of these assumptions, you can put them all together to get your total monthly sales. I put together an Excel template with this revenue model. The yellow highlighted cells are the cells that you need to enter in your assumptions, and it will calculate your total monthly sales. See below:
To access the Excel file template, see our templates page here and download the “Retail Business” revenue model template.

Leave a Reply