
According to the Brewers Association, there were 7,450 breweries in the US in 2018. Of those, only 104 were large or non-craft breweries. The market for small breweries is still booming: 322 new brewpubs and 724 microbreweries opened in 2018 (source). If you’re considering opening a brewery, financial projections are a great way to begin. You will need financial projections to apply for a loan or recruit investors, and they can help you determine your clearest path to profitability.
Template for Brewery Financial Projections
We have created a standard brewery financial projection template to help you create reliable financial projections for lenders, investors, or internal planning. Our template is easy to use as is designed to save you time by creating clear, well-formatted financial statements from the data you provide. Even if you’re completely new to excel, you will be able to use our template.
You can purchase the brewery financial projection template here. In this blog post, we will walk you through how to use the brewery template to create projections for your brewery.
General Template Structure
When you download your template, you will notice it has an instructions / welcome page, and several blue and green tabs. The blue tabs are used for information input, and the green tabs are the financial statements and other reports generated from the data provided.
On each blue tab, there are corresponding light blue cells that direct you to areas where you need to input data. Some blue cells already contain example data in order to guide you as you fill out the template. We encourage you to overwrite or delete the example data to better reflect your unique business.
Assumptions: Investment, Loans, Accounts Receivable, Inventory, and Fixed Assets
The first input tab covers most of the balance sheet items. On this tab, you can define the name of your business, and select a start date. You can also set inventory values, AR terms, loan terms, and investment funds.
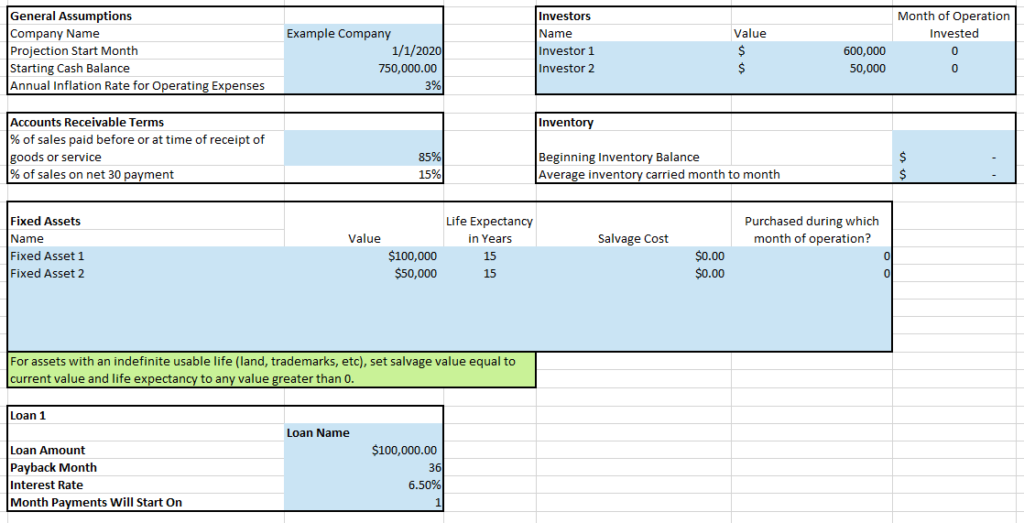
Follow the patterns of the example data on the template, ensuring you fill out all the columns in each box. Be sure to delete any data that does not apply to you, for example, if you do not plan to take out any loans to finance your brewery, you can change the loan amount for Loan 1 to $0.
Investment and Loans
Your starting cash balance will auto-fill in the first box as you change your investment and loan funds. Be sure you have enough cash to cover the purchases of your fixed assets with a surplus to cover expenses in the first few months. When you have entered all your data, you can check your cash flows statement to make sure you estimated your starting cash needs correctly and adjust if necessary. If you cash flows statement shows negative cash in any month, you should consider raising more funds through loans or investment.
Fixed Assets
You have room to input up to 6 fixed assets on the template, but keep in mind many assets can fall into broad categories like leasehold improvements, furniture and fixtures, brewing equipment, and glassware.
Fixed assets required to start a brewery can include:
- Brewing Equipment – $100,000 – $1,000,000 (source)
- Leasehold Improvements or Building if purchasing – minimum 25,000 square feet (source)
- Federal Brewers Bond – $1,000 (source)
- Other Licenses, Fees, and Legal Expenses – state and locality dependent, estimate $3,000-$4,000 (source)
- Kitchen, Bar, and Computer equipment – oven, stoves, ice machines, point-of-sale machines, etc., estimate $30,000 – $40,000
- Furniture and Fixtures – including tables, chairs, bar stools, TVs, signage, sound system, etc., estimate $15,000 – $30,000 depending on size
- Glass and Tableware – cups, plates, silverware, napkins $2,000 – $5,000
Revenue and Cost of Goods Sold
The revenue model for a brewery is complicated. Many breweries are equal parts manufacturing facilities, bars, and restaurants. Our model incorporates all three revenue streams to give you a holistic view of revenue and cost of goods sold.
Beer Manufacturing
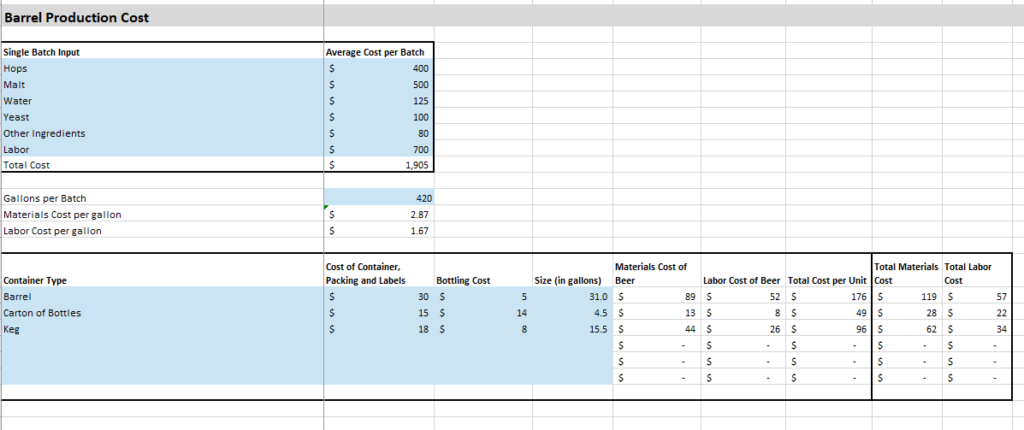
Our model starts by determining the cost of different types of containers of beer that your brewery produces, starting with barrel production. You can input the cost of the various ingredients (hops, barley, yeast, water, etc.) and labor, and the sizes and costs of various containers. The model then calculates the total cost of each type of container of beer you sell.
Taproom Sales
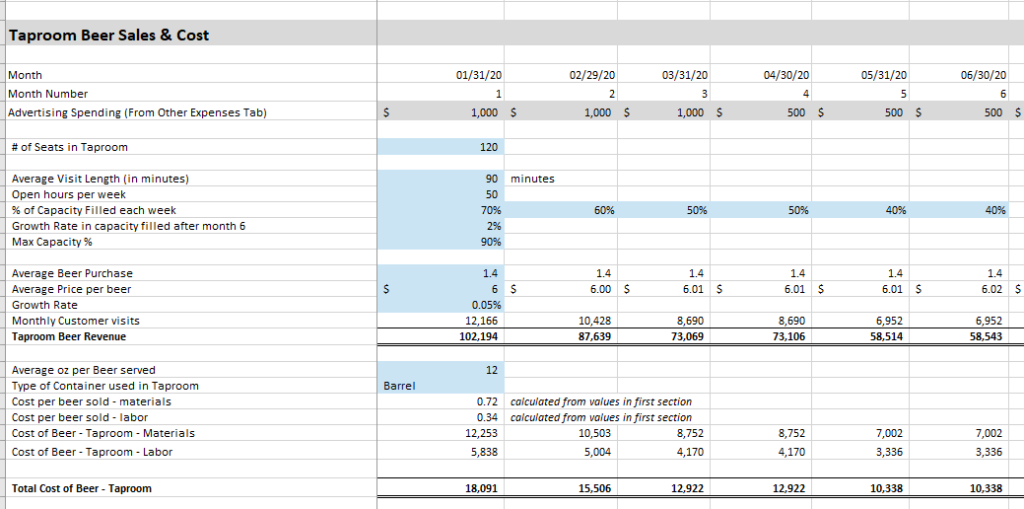
If you plan to sell your beer in a taproom, brewery owned bar, or restaurant fill out the taproom sales category next. Taproom revenue is dependent on customers coming to your location to buy beer. In order to calculate the number of customers each month, we consider the capacity of the taproom. Capacity is calculated by considering the number of the seats in the tap room, the length of the average customer visit, and the number of hours per week the taproom is open. We also consider expected percent of capacity that is used by customers over time, as no taproom can be 100% for all open hours.
For the model to calculate the revenue from and cost of beer sold in the taproom, set the typical number of beers purchased by each customer (pre-set to 1.4). Then, select the type of container (e.g. keg or barrel) that will be used to serve beer in the taproom. The model calculates the revenue and cost of the beer based on the price you provide, and the cost calculated in the first section.
Restaurant Sales
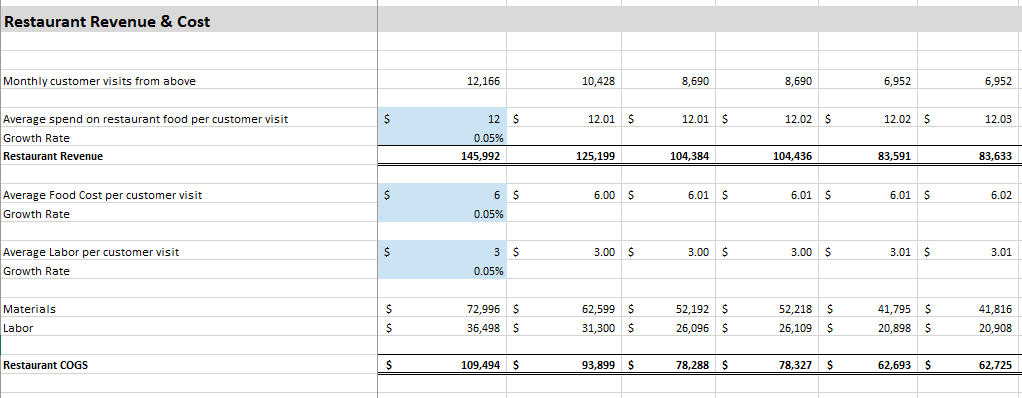
Many breweries also serve food in their tap room. We’ve included a mini version of our restaurant model to calculate revenue from and cost of food served. In this portion of the template, you can set the average spend on food by each customer as well as the direct materials and direct labor that go into restaurant food overall. The template will calculate revenue and COGS.
Wholesale Revenue
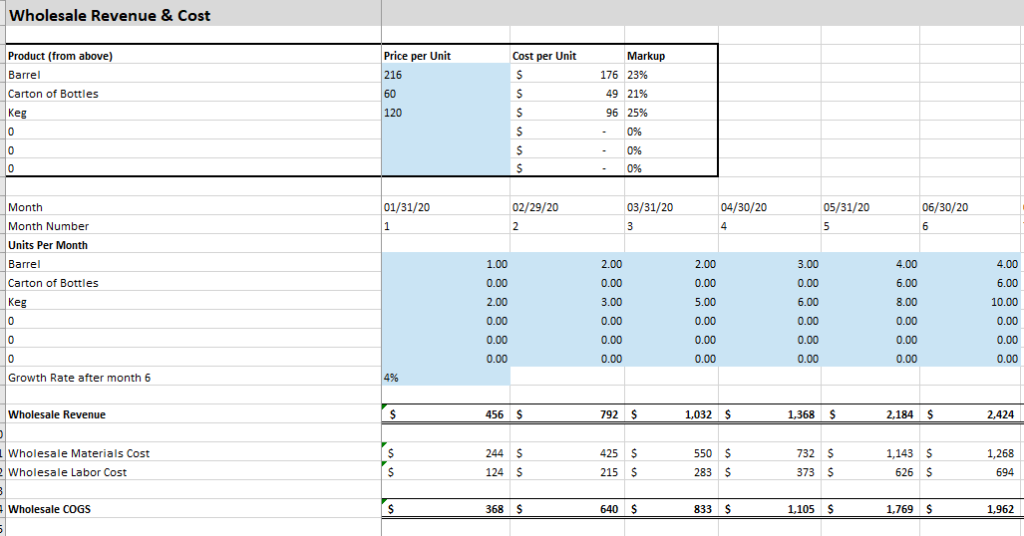
Wholesale is another important piece of the brewery revenue model. In this portion of the model, start by setting the sales prices of each type of container you sell. The markup percentage is included for reference. Then, input the number of each type of container you predict you will sell in the first 6 months. After 6 months, the model uses a growth rate you determine to show sales growth over time. The model calculates sales and COGS based on your inputs.
Other Expenses
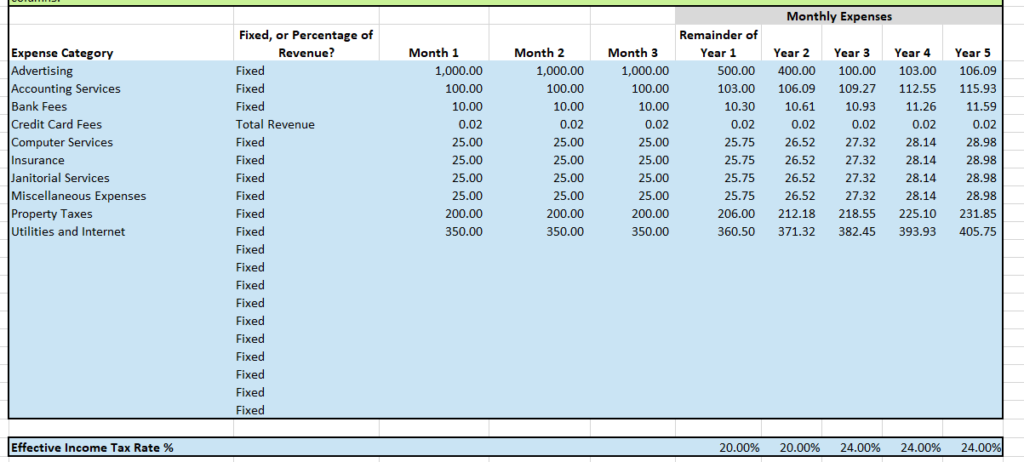
The other expenses tab allows you to build start-up expenses into the model by individually breaking out the first 3 months of operation. Expenses after month 3 are determined based on year of operation to save you time inputting data. The expenses automatically increase over time based on your inputs for year 1, using the inflation rate determined on the assumptions tab. You can override the increase by typing over the formulas in the blue cells.
Be sure to enter monthly, not annual expense amounts. If you have estimated your expenses annually, you can have Excel determine the monthly amount for your by using a formula. For example, if your annual insurance quote is $1,000, type “=1000/12” into the cell.
Note income tax percentages are included at the bottom of the other expenses tab. We pre-fill the income tax percentages with example amounts, but we recommend talking to a tax professional to estimate your effective tax rate.
Salaries and Dividends
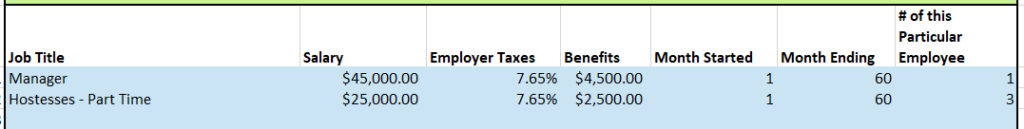
The last input tab is salaries and dividends. This tab is used to determine any indirect labor and dividends paid to shareholders. Note that all the direct labor items, from beer manufacturing to restaurant severs and bar tenders has already been calculated on the revenue tab. Indirect labor can be administrative assistants, CEOs, sales managers, etc.
Note that there are 19 lines for employees on the salaries table, but many more employees can be entered using the far-right column (“# of this particular employee”) and creating categories of employees. For example, if you will hire 2 delivery drivers in month 13 at the same salary, you can enter just one line for driver and change the far-right column to 2, and the model will automatically double the employee expenses for that type of employee.
Dividends are also included on this page. Dividends are draws on the retained earnings of a company and are not technically an expense, although they reduce cash in a period. A company owner or shareholders may choose to compensate themselves with dividends rather than salaries.
Financial Reports and Other Output
When you’ve finished filling out the blue input tabs on your standard template, you can view the green output tabs. The “At a Glance” tab will show you some charts and summary data for your company, including a calculation of the breakeven year:
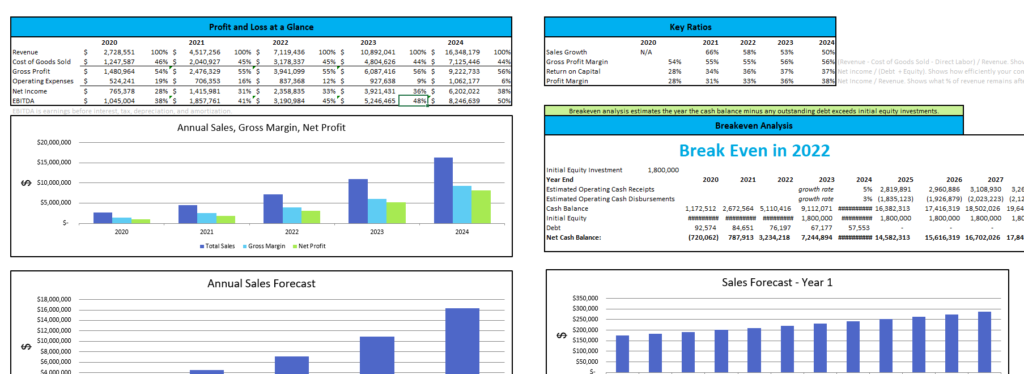
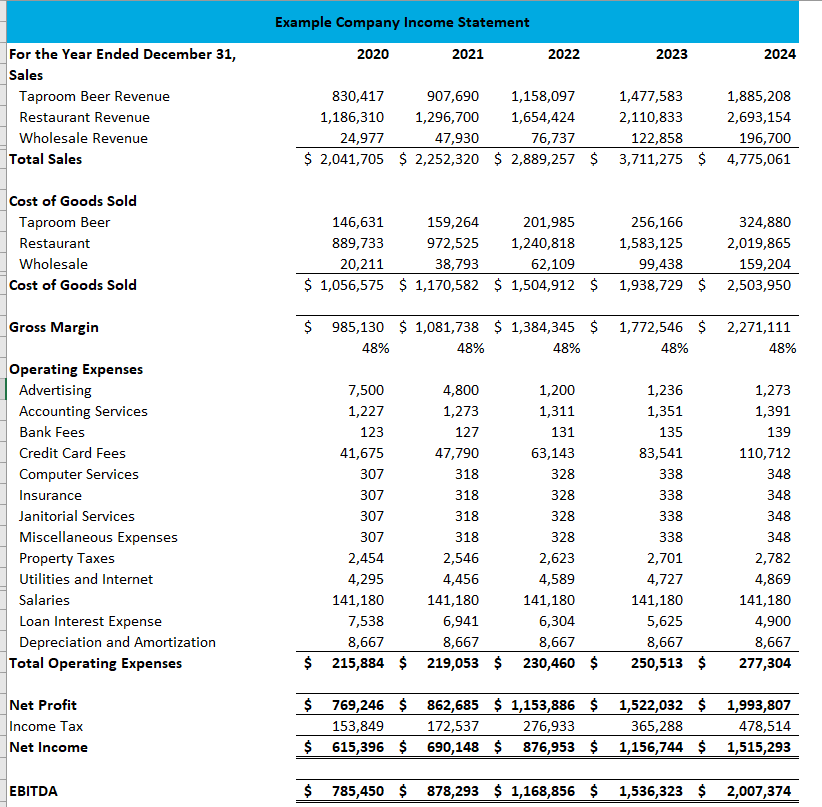
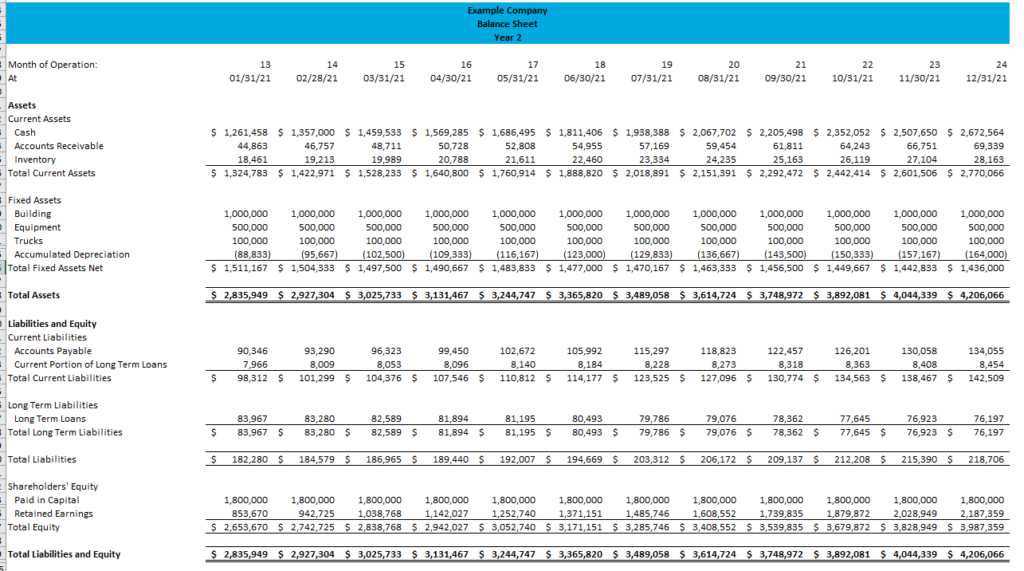
The remaining green tabs are the financial statements in both monthly and annual formats:
Final Notes
Our templates are designed to save you time in creating your projected financial statements. We’re available for support at support@projectionhub.com if you have any questions.
Leave a Reply