 How to Forecast Revenue for a Startup in 12 Easy Steps
Every startup that needs to create revenue projections will likely go through the same basic process to do so. We’ve created a 12 step guide on how to forecast revenue for a startup below, and we have also created various spreadsheet templates for you to use to create your own sales and revenue generation projections.
Step 1 – Total Addressable Market (TAM) – # of Potential Customers
The first step in forecasting revenue projections for a startup is to estimate the total addressable market. This is the entire global market for your product or service. Here some examples:
- If you are starting a coffee shop – your total addressable market would probably be the number of coffee drinkers around the world.
- If you are starting a software company that serves businesses – your total addressable market would be the number of businesses around the world.
- If you are starting a hair salon – your total addressable market would be the number of people with hair around the world.
Step 2 – Forecasting Growth Rate % of TAM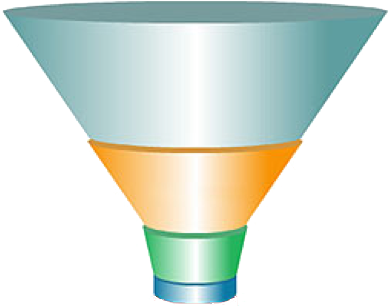
Once you identify your starting point you might know that your total addressable market is growing by some rate each year. So maybe the number of coffee drinkers is increasing by 3% each year. If you are following along with the Excel template I have created, you will need to estimate a monthly growth rate for the Total Addressable Market.
Step 3 – What % of the Addressable Market Can you Actually Serve
Now step one of startup revenue forecasting begs the question. If I open a salon in Miami, Florida, I can’t actually serve every person in the world. You probably have a 30 mile radius of people that would be considered your “Serviceable Market” – these are the people you can actually serve.
If you are building software for businesses to help them manage employees, then your serviceable market is not all businesses, it is probably all businesses with employees.
Step 4 – What % of the Serviceable Market Will you Target
Next, we need to refine your market even more. If your serviceable market for your coffee shop is a 30 mile radius, maybe your target market is the workers in the office buildings within a 1 mile radius. Obviously there may be other competitors that would take some of the serviceable market, so you need to establish your target market.
If you are a salon, your target market might be women between the ages of 25 and 45 within a 5 mile radius to make the most out of your revenue potential.
Step 5 – What % of the Target Market Can you Convert to Leads
Now that you have narrowed down your market to a select target market, the next step of forecasting revenue is to estimate the number of potential customers in your target market that you can convert into leads. For a business with a website, a lead might be someone that visits the website. If you have a retail location like a salon or a coffee shop a lead might be someone that walks into your store. So you need to estimate the number of people from the target market you can turn into leads.
Step 6 – Can you Improve your Conversion Rate
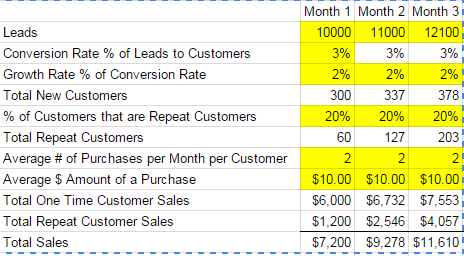
Now with any of these % rates within this model you might be able to improve your conversion rates, or increase the number of leads that turn into customers etc. So when I am creating a custom financial model I add several lines that say “Growth Rate % of Conversion Rate.” This means that you can increase (or decrease) your conversion rates within the model over time.
Step 7 – What % of Leads will you Convert into Customers
Now this number can vary greatly from business to business. For example, a coffee shop might convert 99% of the leads that walk in the door into paying customers, because a lead probably wouldn’t visit without intending to purchase, but with a web based business, a good conversion rate from website visitor into customer might be 3% to 5%. Depending on your industry, you may need to do some research to get an idea of what you can expect in terms of conversion rates from leads to customers.
Step 8 – Churn Rate – What % of Customers will you Lose Each Month
A crucial part of forecasting revenue is determining what percentage of your new customers won’t ever come back again. For a salon, hopefully customers are happy and they come back on a regular basis for a haircut, but for a coffee shop, maybe a customer was just passing through the area and happened to stop by for coffee, or maybe they hated your coffee. You need to estimate what % of customers won’t come back.
Step 9 – What is the Average $ Amount of a Customer Purchase
The next estimate you need to make is the average purchase of a customer. Many of our financial projection templates help you automatically calculate an average customer ticket like our coffee shop spreadsheet. For example, if someone buys a coffee for a $1 and a muffin for $2.50, the purchase amount should be $3.50.
Step 10 – What is the Growth Rate % of the Average Purchase $ Amount
Again this could increase over time. As a salon, what if you start offering hair coloring services or maybe perms, or some other service that could increase the average purchase amount per customer.
Step 11 – On Average How Many Purchases Per Customer Per Month
Lastly for startup revenue projections, we need to know how many purchases per customer per month on average. If you are a coffee shop and have a lot of “regulars” your average # of purchases per customer per month might be 10. If you are a salon on the other hand and the average customer gets a haircut every 4 months, then your average purchase per customer per month would be .25 purchases.
Step 12 – Total Purchases x Total Average $ per Purchase = Total Revenue Generated
Finally, it is time to bring it all together. You just need take your Total purchases from all customers x the average purchase amount to = your total projected revenue.
Again, this process should work and can be easily adapted for just about any business. If you have any specific questions about how to forecast revenue growth for a startup or business, you can visit our FAQ page for more information or contact us!
Best of luck!
